Blog
Understanding the Importance of Real-Time Analytics in the Modern Clinical Laboratory

May 2, 2024
We all know that pathology groups and clinical laboratories (molecular and reference) collect a mountain of data daily. From patient demographics to test results and everything in between, data is collected as specimens are accessioned and processed, and lab reports are generated and distributed.
This data is typically collected and stored securely within a laboratory information system (LIS meaning medical), or LIS system. Traditionally, the LIS system (sometimes also called pathology lab software) has been very good at collecting and storing lab informatics, but not at providing easily discernible real-time data to aid laboratory information system operations with the simple push of a button.
Fortunately, that status is changing as modern and full-featured lab information systems (the best LIS) now support data mining, a process by which a lab can analyze its internal data to make more informed business decisions and improve lab operations (efficiency and productivity).
Data mining has gained importance as labs across all testing disciplines search for new ways to improve technical and financial operations without adding to already skyrocketing operating costs.
The best lab directors and managers are looking inward and using advanced laboratory information system software technology to put the data they’ve already gathered to work for them, using it first to gain insight into their operations and second to formulate a corresponding action that will improve the business.
Now that we’ve established the importance of data mining and real-time analytics, let’s delve into how widgets and dashboards can represent the data pulled from modern feature-rich medical LIS systems.
Widgets are small, standalone applications built to filter and display real-time lab information, and dashboards are the visual representations of this information that can be tailored to fit the role, the user, or the specific lab department.
Pathology Lab Software and Lab Informatics
LigoLab Informatics Platform is an example of a modern pathology lab software (pathology management software) that supports real-time analytics. The all-in-one platform with LIS system and laboratory billing (laboratory revenue cycle management) functions includes a dashboard engine that enables platform administrators to configure various dashboard widgets (tables, pie, bar, line charts, etc.) based on out-of-the-box statistical reports, custom scripting, and custom SQL queries.
“Once configured, all pathology software users can add pre-built widgets to their dashboards, choosing from the hundreds of dashboard widgets and layouts available within the platform,” said Allison Still, LigoLab’s LIS Product Manager.
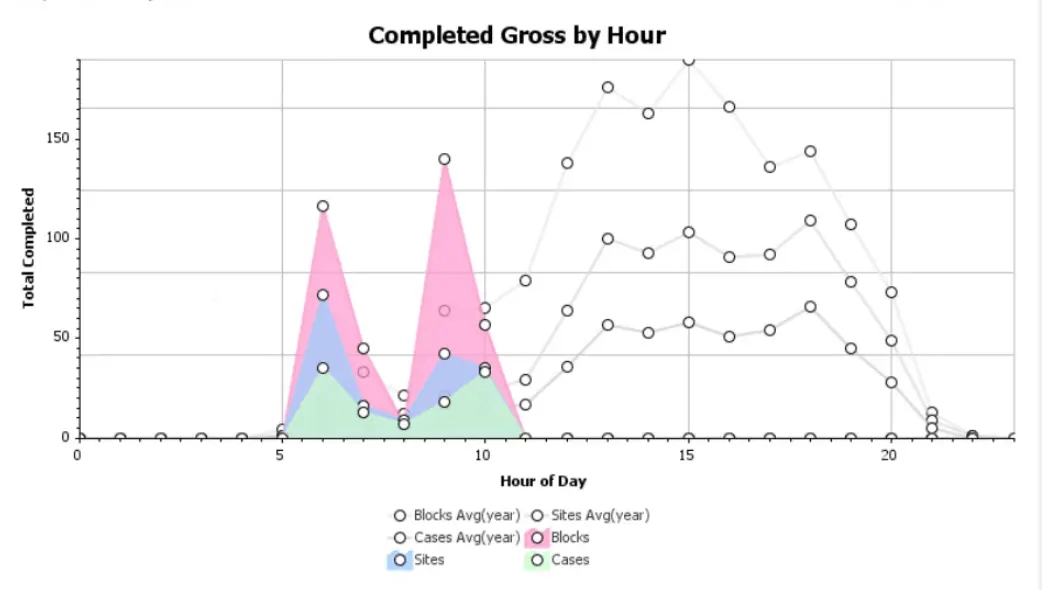
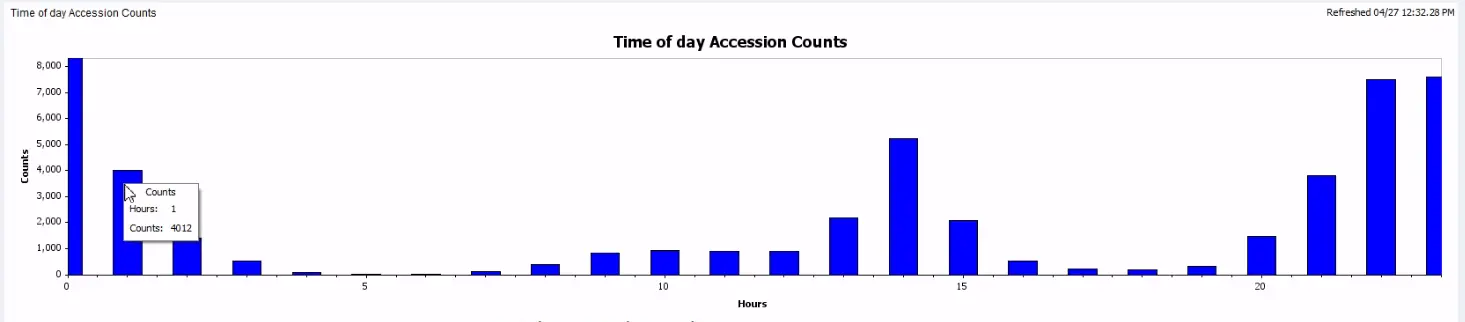
Here are some examples of dashboard widgets that have been configured within the LigoLab platform:


Real-Time Pathology Reporting Software and Laboratory Information Systems
Often, as technology advances, an application that started as a “nice to have” can quickly become a “need to have.” That’s the case with data mining from an LIS system in healthcare.
To learn more, we recently spoke with Joseph Guido, an Anatomic Pathology Consultant intimately familiar with pathology reporting software and how the best LIS systems supported by the best LIS software vendors can help labs remove deficiencies and grow efficiently.
“Lab operators want to see real-time reporting by feeding data into laboratory information systems with this type of functionality,” he said. “I think it’s becoming a standard across the industry. Everyone wants to be able to mine their LIS system database for insights into their operations, be it from a high level or a more granular perspective.”
Guido continued by suggesting that the sky is the limit for lab informatics with a modern lab information system, with the lab and the medical LIS company working together to refine the design that best represents the data graphically.
“Generally speaking, most dashboard widgets start with a conversation between the lab and LIS company developers that support the laboratory information system. It can be as simple as a design on paper submitted to the LIS lab vendors development team,” Guido said.
Practical LIS System Applications in Today’s Clinical Lab
As shown in the examples above, dashboard widgets provide a snapshot of the lab’s efficiency and productivity while enabling lab directors and managers to identify potential issues and take action before it’s too late.
For instance, dashboard widgets can assist with client services by tracking client accounts and identifying negative trends.
“With this tool, the lab is alerted to any significant change in volume over a given amount of time with a client,” Guido said. “It’s better to know of a problem in real-time rather than finding out about an issue and an unhappy client a month later. With real-time data available to the Client Services team, they can proactively pick up the phone, figure out the issue, and resolve it.”
Here are a few other scenarios where dashboard widgets can make a positive difference in lab workflow management:
- Sample Tracking Status: A widget can be created to track the status of each sample from order inception to specimen processing to reporting. In this scenario, the lab knows the number of specimens processed and the time needed to complete each step in each testing workflow. If there are identified bottlenecks, adjustments to workflows can be made.
- Turnaround Time: A widget can be created to track the start and end times for each test or assay run by the lab. The data gathered can then be compared with target times. If a test consistently takes longer than expected for completion, the lab can drill down into the data to find out why.
- Quality Control: A widget can be created to track quality control metrics, alerting lab managers to any potential issue with test accuracy long before it can negatively impact patient care.
- Equipment Maintenance: A widget can be created to track the status of laboratory equipment and identify when maintenance may be needed. Properly maintained and serviced equipment reduces downtime and improves efficiency.
- Resource Utilization: A widget can track data on test volumes to identify times when human resources may be overburdened or underutilized, allowing lab managers to adjust staffing as needed.
Don’t Forget About Laboratory Billing Data
Laboratory revenue cycle management (lab RCM) data is another important area where dashboard widgets can positively impact productivity and revenue. By capturing key lab billing metrics (KPIs) and then analyzing them, the lab billing department can be alerted to any discrepancies affecting days in accounts receivable, the net collection rate, and the denial rate.
Here are a few other examples where tracking metrics with dashboard widgets can positively affect the laboratory billing process (RCM cycle):
- Insurance Claims: Dashboard widgets can be used to monitor the status of insurance claims (including the number of claims submitted, and the number of claims denied), plus the average time it takes to receive payment.
- Charge Capture: Dashboard widgets can help labs monitor charge capture rates (the percentage of billable services they bill for) and stop revenue leakage.
- Pricing: Dashboard widgets can also be used to monitor pricing for services such as the average reimbursement rate for each test on the test menu. This information can help labs adjust pricing strategies to be more competitive and maximize revenue.
Now that we’ve demonstrated the importance of dashboard widgets, let’s talk about how long it takes to go from a concept to a reality in LigoLab’s dynamic LIS software environment.
According to Still, the project turnaround time is relatively quick.
“Once mapped out, the actual build goes fast,” she said. “Our experienced developers first take the time to understand the project and then the build starts. Usually, there’s a bit of back and forth between the lab and the pathology lab software developer before the design is finalized and added to the lab’s production environment.”
How Advanced Laboratory Information Systems Modernize and Digitize Lab Operation
If you are ready to learn more about how dashboards and the LigoLab Informatics Platform (the only all-in-one LIS & RCM laboratory solution out there) can help your clinical or pathology lab modernize and grow efficiently, click here to schedule a pathology lab software demonstration with a LigoLab LIS Product Specialist.


